TAGS:Flag formation,continuation patterns,Pennant Formation,a bearish pennant,bullish pennant,a bear flag formation,Rectangles,Wedges,Triangles,Pennants,Flags,Triangle Formation,Wedge Formation and Rectangle Formation
Trend Continuation Patterns
Technical analysis provides charts that reinforce the current trends.
These chart formations are known as continuation patterns. They consist of fairly short consolidation periods. The breakouts occur in the same direction as the original trend.
The most important continuation patterns are:
1. Flags
2. Pennants
3. Triangles
4. Wedges
5. Rectangles
Flag formation
The flag formation provides signals for direction and price objective. This formation represents a brief consolidation period within a solid and steep upward or downward trend. The consolidation itself is bordered by a support line and a resistance line, which are parallel to each other or very mildlyconverging, making it look like a flag (parallelogram) and tends to be sloped in the opposite direction from the slope of the original trend, or is simply flat. The previous sharp trend is resembles a flagpole.
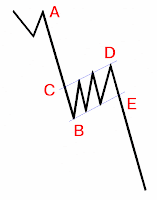
If the original trend is going down, the formation is called a bearish flag. (See Figure 5.22.) As Figure 5.22. shows, the original trend is sharply down. The flagpole is measured between points A and B. The consolidation period occurs between the support line B to E and the resistance line C to D. When the price penetrates the support line at point E, the trend resumes its fall, with the price objective F, measured from E. The price target is of about equal amplitude with the flagpole's length (A to B), measured from the breakout point through the support line (B to E.)
In the numerical example, the height of the flagpole is measured as thedifference between 140.00 and 120.00 equals 2000 pips. Once the support line is broken at 125.00, the price target is 105.00, as 2000 pips from 125.00.
Pennant Formation
The pennants are closely related to the flags. The same principles apply. The sole difference is that the consolidation area better resembles a pennant, as the support and resistance lines converge. If the original trend is bullish, then the chart pattern is a bullish pennant. In Figure 5.23., the pennant pole is A to B The pennant-shaped consolidation is framed by C, B, and D. When the market breaks through the resistance line B to D, the price objective is E. The amplitude of the target price is D to E, and it is equal to the pennant pole A to B. The price target measurement starts from the breakout point.
 |
| Figure 5.22. SHAPE 2 Diagram of a bear flag formation |
 |
| Figure 5.22.SHAPE1 Diagram of a bear flag formation |
In the numerical example, the height of the pennant pole is measured as the difference between 1.5500 and 1.4500, or 1000 pips. Once the resistance line is broken at 1.5200, the price target is 1.6200, as 1000 pips from 1.5200.
 |
| Figure 5.23. SHAPE 2Diagram of a bullish pennant. |
 |
| Figure 5.23. SHAPE 1 Diagram of a bullish pennant. |
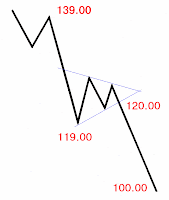
If the original trend is going down, then the formation is a bearish pennant. In Figure 5.24., the pennant pole is A to B. The pennant-shaped consolidation is framed by C, B and D. When the market breaks through the support line B to D, the objective price is E. The amplitude of the target price is D to E, and it is equal to the pennant pole A to B. The price target measurement starts from the breakout point.
In the numerical example, the height of the flagpole is measured as the difference between 139.00 and 119.00, or 2000 pips. Once the support line is broken at 120.00, the price target is 100.00, as 2000 pips from 120.00.
 |
| Figure 5.24.SHAPE 2 Diagram of a bearish pennant |
 |
| Figure 5.24. SHAPE 1 Diagram of a bearish pennant |
Do you like to read about others Trend Continuation Patterns like Triangle Formation click here or Wedge Formation and Rectangle Formation click here
Copyright (c)Tooklook.net and FOREX. On-line Manual For Successful Trading


0 comments:
Post a Comment